Image Details
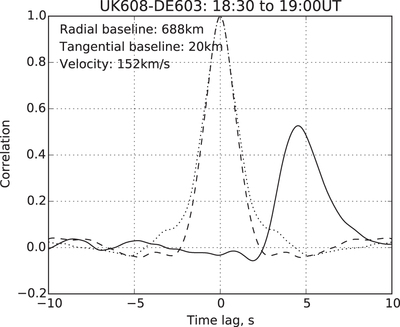
Caption: Figure 4.
Plots of auto- (dotted and dashed lines with peak values of 1.0) and cross-correlation function of time series’ calculated from UK608 and DE603 data between 18:30 and 19:00 UT on 2015 November 10.
Other Images in This Article

Copyright and Terms & Conditions
© 2016. The American Astronomical Society. All rights reserved.
Copyright ©
2025 Astronomy Image Explorer. All Rights Reserved.