Image Details
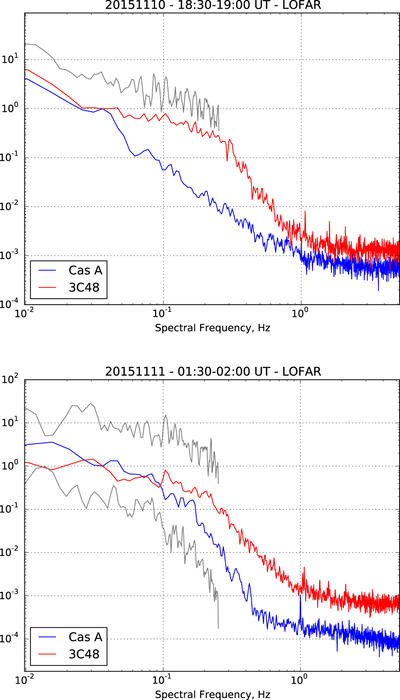
Caption: Figure 3.
Example power spectra from the observation of 2015 November 10–11: 3C48 data from international station UK608 are plotted in red; Cassiopeia A data from core station CS501 are plotted in blue. For ease of comparison these spectra were normalized such that the level is matched at the low spectral frequencies. Top: spectra from 18:30 to 19:00 UT; plotted in gray is a power spectrum of the 3C48 data averaged to a 2 s cadence. Bottom: spectra from 01:30 to 02:00 UT; plotted in gray are power spectra from both 3C48 (upper) and Cassiopeia A (lower) data averaged to a 2 s cadence.
Other Images in This Article

Copyright and Terms & Conditions
© 2016. The American Astronomical Society. All rights reserved.
Copyright ©
2025 Astronomy Image Explorer. All Rights Reserved.