Image Details
Caption: Figure 5.
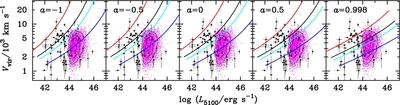
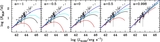
Distribution of virial velocities for the BLR clouds as a function of optical continuum luminosity. Panels from left to right are for different values of BH spin, from a = −1.0 to a = 0.998. Each panel plots four curves for different  (corresponding to the same color). The black points are the RM AGNs, the magenta points SDSS quasars from Hu et al. (2008). The contours mark 20%, 50%, and 80% of the sample. The regions of the diagram not occupied by the quasar sample may represent massive BHs and accretion rates
  , where the present approach does not apply.
Other Images in This Article
Copyright and Terms & Conditions
© 2014. The American Astronomical Society. All rights reserved.
Copyright ©
2025 Astronomy Image Explorer. All Rights Reserved.