Image Details
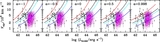
Caption: Figure 4.
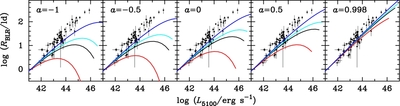
Relation between the BLR lag and the luminosity at 5100 Å. Panels from left to right are for different values of BH spin, from a = −1.0 to a = 0.998. Each panel plots four color lines for different accretion rates. The normalization constants, for  , are as follows: a = −1: R0 = (18.4, 12.0, 10.6, 8.4) ld; a = −0.5: R0 = (16.3, 11.2, 10.0, 8.2) ld; a = 0: R0 = (14.2, 10.3, 9.4, 7.9) ld; a = 0.5: R0 = (12.0, 9.3, 8.6, 7.5) ld; and a = 0.998: R0 = (8.3, 7.4, 7.2, 6.6) ld.
Other Images in This Article
Copyright and Terms & Conditions
© 2014. The American Astronomical Society. All rights reserved.
Copyright ©
2025 Astronomy Image Explorer. All Rights Reserved.