Image Details
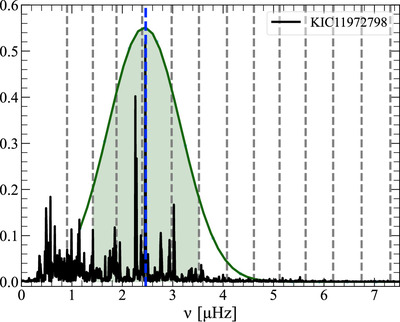
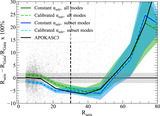
Caption: Figure 9.
Example frequency spectrum measurement. In black, we plot the frequency spectrum for KIC 11972798. This star has M* = 0.9314 ± 0.1115M⊙ and R* = 36.8295 ± 0.0535R⊙. The dotted gray lines are the l = 0 mode measurements computed from GYRE. The dotted blue line is νmax = 2.4582μHz for this star. The green Gaussian shows the Gaussian weights applied to the modes computed by GYRE. The green shaded region indicates where the modes are truncated to compute Δν with a subset of modes. See Section 4.3.2 for details of how we measure Δν from the theoretical frequency spectra.
Other Images in This Article

Show More
Copyright and Terms & Conditions
© 2025. The Author(s). Published by the American Astronomical Society.
Copyright ©
2025 Astronomy Image Explorer. All Rights Reserved.