Image Details
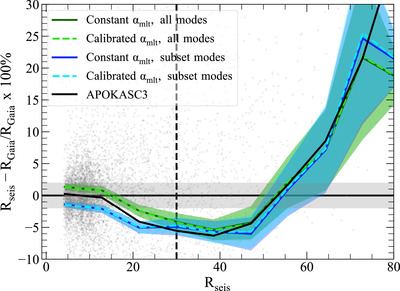
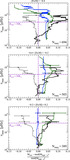
Caption: Figure 10.
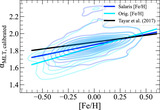
Fractional difference between Rseis and Rgaia vs. Rseis for different models. The solid colored line uses FΔν correction factors for uncalibrated models and the dashed lines use the αmlt–[Fe/H] calibration. The green lines use all of the available modes computed by GYRE to measure Δν in the theoretical frequency spectrum. The blue lines use a subset of modes to compute the theoretical Δν. See Sections 4.3.1 and 4.3.2 for details of the mixing-length calibration and frequency spectrum measurement. The solid black line is the mass given in the APOKASC3 catalog. The black vertical dashed line and the solid black horizontal line are meant to guide the eye. The vertical black dashed line shows where we begin to consider stars as luminous giants and the solid black horizontal line shows where there is zero offset between the seismic radius and the parallactic radius. The gray shaded region shows ± 2% differences between the seismic radius and parallactic radius. Refer to Section 4.4 for discussion of this plot.
Other Images in This Article
Show More
Copyright and Terms & Conditions
© 2025. The Author(s). Published by the American Astronomical Society.