Image Details
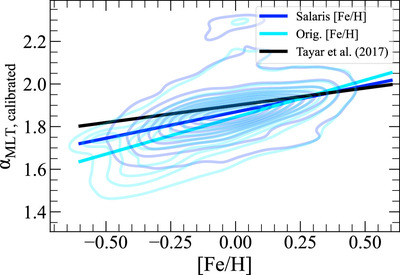
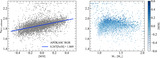
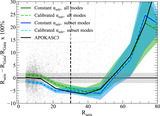
Caption: Figure 8.
Calibrated mixing length as a function of [Fe/H] for different methods. The different colored lines show the Salaris-corrected [Fe/H] (calibrated αmlt relationship; dark blue), the original [Fe/H] (calibrated αmlt relationship; light blue), and the calibrated αmlt relationship determined by J. Tayar et al. (2017) using YREC stellar evolution models (black). The contour lines for the Salaris-corrected and original [Fe/H] relationships indicate the density of the APOKASC3 points.
Other Images in This Article
Show More
Copyright and Terms & Conditions
© 2025. The Author(s). Published by the American Astronomical Society.
Copyright ©
2025 Astronomy Image Explorer. All Rights Reserved.