Image Details
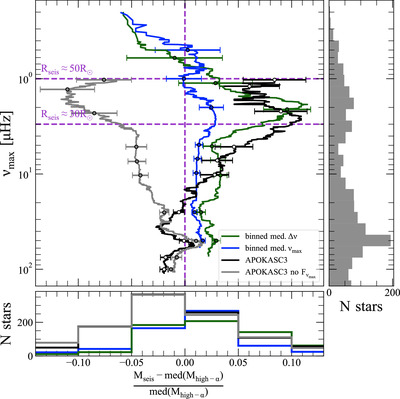
Caption: Figure 5.
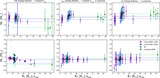
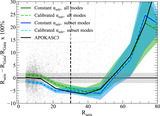
Component analysis of the scaling relations using high-α-sequence stars. The x-axis is the fractional mass difference between the mass computed using the scaling relations and the median mass of the high-α sequence. The purple vertical dashed line is the zero-offset point and the purple horizontal dashed line is the ﹩{\nu }_{{\rm{\max }}}﹩ value where we consider stars to be luminous giants. The green and blue lines are the rolling medians of the masses computed using only Δν and ﹩{\nu }_{{\rm{\max }}}﹩, respectively. The window size for computing the rolling median is 150 points. The black line is the full scaling-relation mass using the ﹩{F}_{{\nu }_{{\max }}}﹩ correction parameter. The gray line is the full scaling-relation mass omitting the ﹩{F}_{{\nu }_{{\max }}}﹩ correction factor. The points are the median values of the offset at specific ﹩{\nu }_{{\rm{\max }}}﹩ values. The error bars on these points are the 1.48 * MAD divided by the square root of the number of points used to compute the rolling median at a given point, which is set equal to the window size. The histogram on the y-axis shows the number of stars in ﹩{\nu }_{{\rm{\max }}}﹩ bins. The histogram on the x-axis shows the number of stars in bins of fractional difference between the seismic masses and the median high-α-sequence mass. Section 3.2.2 interprets the results of this figure.
Other Images in This Article
Show More
Copyright and Terms & Conditions
© 2025. The Author(s). Published by the American Astronomical Society.