Image Details
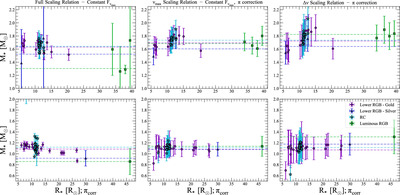
Caption: Figure 4.
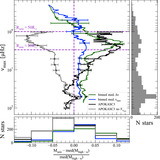
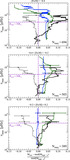
Component analysis of the scaling relations using clusters in the M*vs. R* plane. The different colors indicate the different samples within the cluster. The colored dotted lines are the weighted mean masses of a particular sample within a cluster. Left: masses computed using the full scaling relation with a constant ﹩{F}_{{\nu }_{{\max }}}﹩value for RGB and RC stars. Middle: masses using the ﹩{\nu }_{{\rm{\max }}}﹩-only scaling relation with a constant ﹩{\nu }_{{\rm{\max }}}﹩ for RGB and RC stars and parallax-corrected Gaia radii. Right: masses using the Δν-only scaling relation with parallax-corrected Gaia radii. See Section 3.2.1 for discussion of this figure.
Other Images in This Article
Show More
Copyright and Terms & Conditions
© 2025. The Author(s). Published by the American Astronomical Society.