Image Details
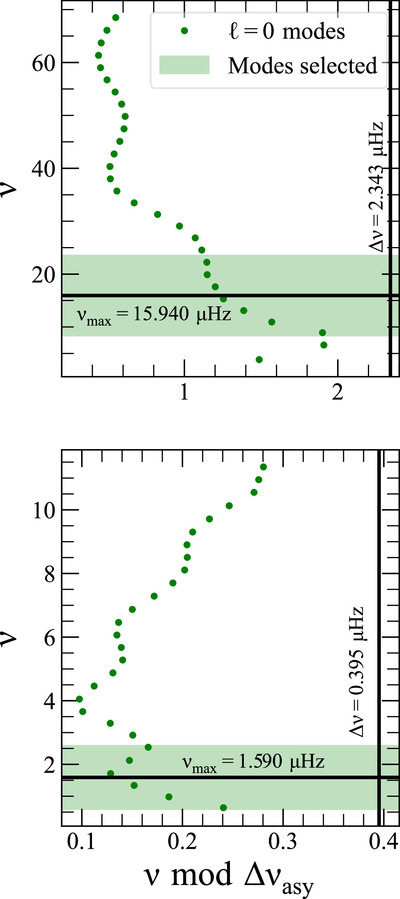
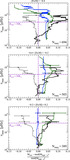
Caption: Figure 15.
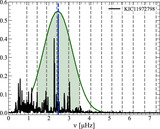
Echelle diagram for synthetic frequency spectra. Top panel: synthetic frequency spectrum for a 1M⊙, 15R⊙ star. Bottom panel: synthetic frequency spectrum for a 1M⊙, 50R⊙ star. The green shaded region is the width of the Gaussian envelope used to select the modes to compute Δν.
Other Images in This Article
Show More
Copyright and Terms & Conditions
© 2025. The Author(s). Published by the American Astronomical Society.
Copyright ©
2025 Astronomy Image Explorer. All Rights Reserved.