Image Details
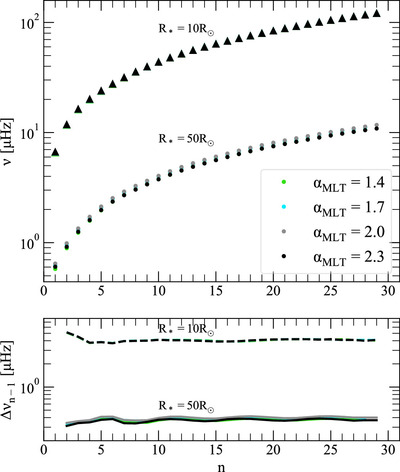
Caption: Figure 14.
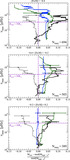
Frequency spectra for models of different stellar radius and mixing length. Top panel: the y-axis of this figure is the frequency of a given mode on the x-axis. The triangular points are measurements for a model with a radius of 10R⊙. The circular points have a radius of 50R⊙. The point colors indicate the mixing length of the model. Bottom panel: frequency separations between adjacent modes plotted as a function of mode. The dotted lines are models with R* = 10R⊙ and the solid lines are with R* = 50R⊙. The colors of the lines show the different mixing lengths and have the same colors as the legend in the top panel. Section 4.4.1 discusses the results of this figure.
Other Images in This Article
Show More
Copyright and Terms & Conditions
© 2025. The Author(s). Published by the American Astronomical Society.