Image Details
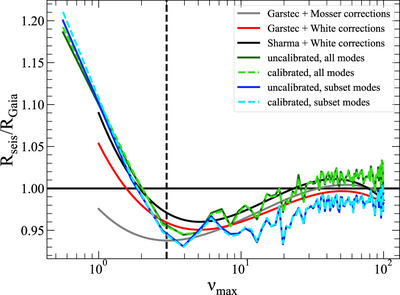
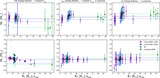
Caption: Figure 11.
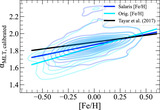
Comparison between the calibration scales used in this paper and the APOKASC3 catalog. The axes are the seismic radius computed with different correction terms over the Gaia radius vs. ﹩{\nu }_{{\rm{\max }}}﹩. The results from this study are given by the dark blue, light blue, dark green, and light green lines. They are compared to the calibration polynomials available in the APOKASC3 catalog given by the red, gray, and black lines.
Other Images in This Article
Show More
Copyright and Terms & Conditions
© 2025. The Author(s). Published by the American Astronomical Society.
Copyright ©
2025 Astronomy Image Explorer. All Rights Reserved.