Image Details
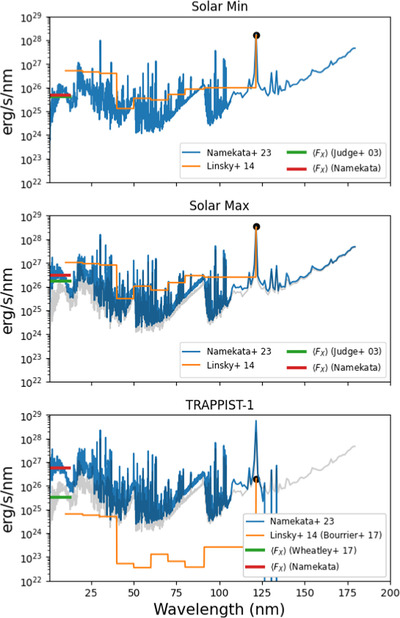
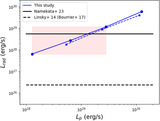
Caption: Figure 8.
Reconstructed spectrum (0.5–180 nm) of the Sun (minimum and maximum) and TRAPPIST-1 using the F–Φ scaling relation of K. Namekata et al. (2023, blue), and the F(EUV)–F(Lyα) of J. L. Linsky et al. (2014, orange). The peak of the Lyα line is used to constrain the J. L. Linsky et al. (2014) extrapolation. It is taken from V. Bourrier et al. (2017b) in the case of TRAPPIST-1. The observed X-ray flux is shown in green, while the average value from the K. Namekata et al. (2023) extrapolation is shown in red. The gray shaded spectrum in the middle and bottom panels is the observed solar minimum spectrum of the top panel.
Other Images in This Article
Copyright and Terms & Conditions
© 2024. The Author(s). Published by the American Astronomical Society.