Image Details
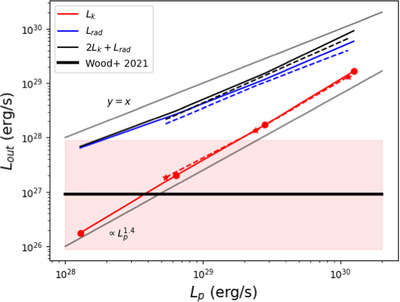
Caption: Figure 5.
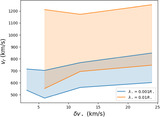
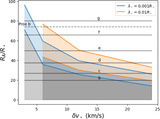
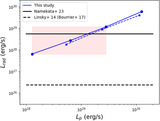
Illustration of the energy balance in our simulations according to Equations (10)–(11). Red lines correspond to the kinetic energy luminosity while dark blue lines correspond to the radiated energy. The sum is shown in black and corresponds to the expected input energy in light blue. Dashed lines are used when the turbulence correlation length scale λ ⋆ = 0.01. The target mass-loss rate (expressed in kinetic luminosity) is given by the horizontal dark line, with the reported uncertainties of Figure 1 in red shades.
Other Images in This Article
Copyright and Terms & Conditions
© 2024. The Author(s). Published by the American Astronomical Society.
Copyright ©
2025 Astronomy Image Explorer. All Rights Reserved.