Image Details

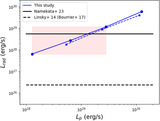
Caption: Figure 1.
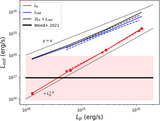
The B. E. Wood et al. (2021) ﹩\dot{M}-{F}_{X}﹩ law with updated measurements from M dwarfs and slingshot prominences. The blue line represents the fitted law (Equation (1)). The dashed lines, one-tenth and 10 times the fitted law, encompass most of the 36 data points, with only a few outliers on the subgiant/giant branch. The filled regions in red and gray correspond to the mass-loss rate estimates for TRAPPIST-1 and Proxima Cen, respectively. The black cross symbol is the upper bound for Proxima Cen (all down arrows represent upper bounds).
Other Images in This Article
Copyright and Terms & Conditions
© 2024. The Author(s). Published by the American Astronomical Society.
Copyright ©
2025 Astronomy Image Explorer. All Rights Reserved.