Image Details
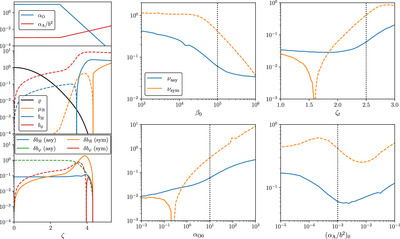
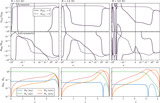
Caption: Figure 7.
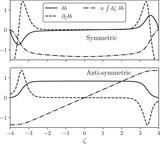
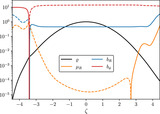
Left column illustrates the model for reference with the setup in Section 5.1, showing the diffusivity profiles (upper panel), the steady-state solution (middle panel), and the perturbation modes (lower panel). The growth rates are ν sym = −0.10 and ν asy = 0.035. Right two columns present the dependence of ν sym (orange lines) and ν asy (blue lines) on different parameters: β 0, ζ t , α O0, and ﹩{\left({\alpha }_{{\rm{A}}}/{b}^{2}\right)}_{0}﹩ (see Section 5.2). Note that negative values are shown in dashed lines. The vertical dotted lines are plotted in each panel, indicating the value taken by the reference model.
Other Images in This Article
Copyright and Terms & Conditions
© 2024. The Author(s). Published by the American Astronomical Society.