Image Details
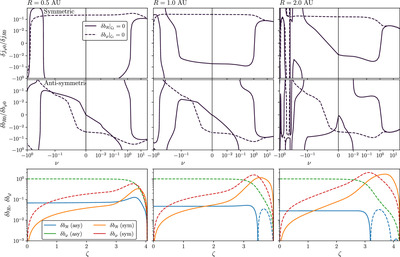
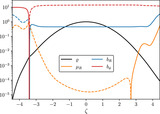
Caption: Figure 4.
Eigensolutions at disk radii (R/au) ∈ {0.5, 1, 2} presented in different columns (see also Section 4.2.1). The top row shows the phase diagrams for the symmetric perturbation modes in the space spanned by the dimensionless {ν sym} × {δ j φ0/δ j R0}. The solid and dashed contours indicate the tracks of ﹩\delta {b}_{R}{| }_{{\zeta }_{1}}=0﹩ and ﹩\delta {b}_{\varphi }{| }_{{\zeta }_{1}}=0﹩ (ζ 1 is the altitude of the wind base), respectively, and their intersections indicate eigensolutions. Note that the negative-ν and positive-ν regions, separated by a vertical solid line, have different scales in ν. The middle row is similar to the top row but shows the phase diagrams for the antisymmetric modes in the {ν asy} × {δ b R0/δ b φ 0} phase space. The bottom row presents the eigensolutions with the largest growth rates for both modes. Note that the symmetric modes always have negative growth rates, and that the tracks seem to converge at large positive ν but they never actually cross each other.
Other Images in This Article

Copyright and Terms & Conditions
© 2024. The Author(s). Published by the American Astronomical Society.