Image Details
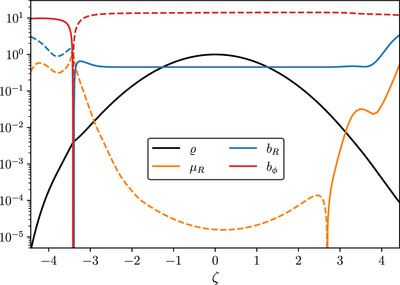
Caption: Figure 6.
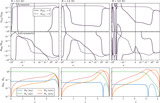
Similar to the lower row of Figure 3, but showing a nonsymmetric solution using the diffusivity profiles at R = 1 au as an example. Colors distinguish different physical quantities, while the line shapes indicate the signs (solid for positive, dashed for negative).
Other Images in This Article

Copyright and Terms & Conditions
© 2024. The Author(s). Published by the American Astronomical Society.
Copyright ©
2025 Astronomy Image Explorer. All Rights Reserved.