Image Details
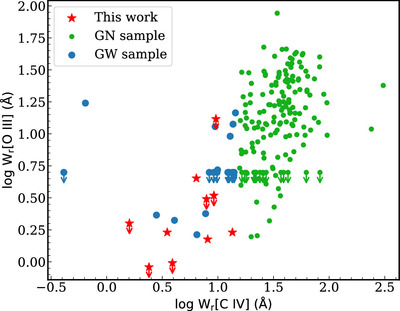
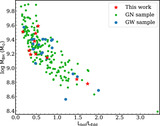
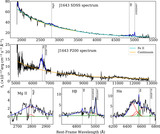
Caption: Figure 7.
log W r [O III] vs. log W r [C IV] for our WLQ sample (red stars) and the comparison samples (blue and green dots). Upper limits are indicated by the downward arrows. The two REWs appear to be positively correlated, and the WLQ and GW quasars occupy the bottom left corner.
Other Images in This Article
Copyright and Terms & Conditions
© 2024. The Author(s). Published by the American Astronomical Society.
Copyright ©
2026 Astronomy Image Explorer. All Rights Reserved.