Image Details
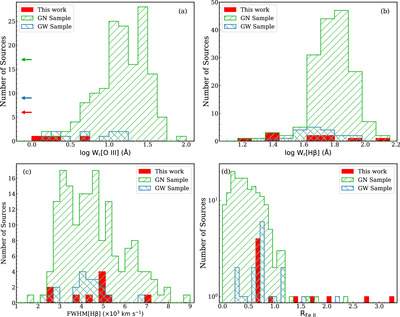
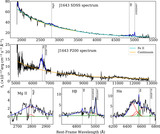
Caption: Figure 3.
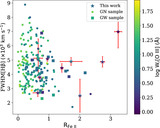
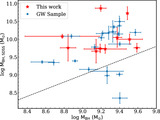
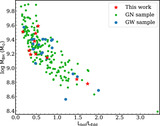
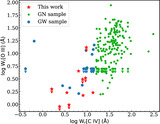
Distributions of (a) log W r [O III], (b) log W r [H β], (c) Hβ FWHMs, and (d) R Fe II for our WLQ sample. For comparison, the distributions for the GW and GN samples are also shown in each panel. For the W r [O III] distributions, upper limits are indicated by the leftward arrows and the y-axis values of the arrows represent the number of sources with upper limits in the corresponding samples. Our WLQs show weak W r [O III] and stronger Fe II emission compared to typical quasars. Their Hβ emission is not particularly weak (K-S test P null = 0.06).
Other Images in This Article
Copyright and Terms & Conditions
© 2024. The Author(s). Published by the American Astronomical Society.