Image Details
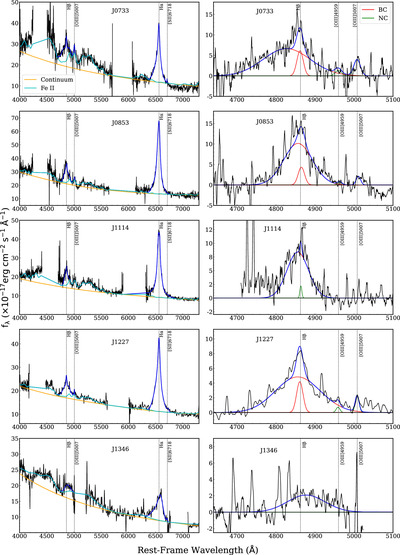
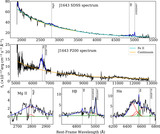
Caption: Figure 2.
Rest-frame optical spectra for our 10 sources and the best-fit models. Positions of major emission lines are marked. The left panel shows the broad-band spectra (black curves) smoothed with box convolutions (ranging from 5 to 10 pixels). The blue curve represents the best-fit continuum + emission-line model, The orange curve shows the power-law + polynomial (if present) continuum, and the cyan curve shows the Fe II pseudo continuum. The right panel shows zoomed-in views of the spectra in the Hβ region, fitted with broad (red curves) and/or narrow (green curves) Gaussian profiles for the Hβ and [O III] emission lines.
Other Images in This Article
Copyright and Terms & Conditions
© 2024. The Author(s). Published by the American Astronomical Society.