Image Details
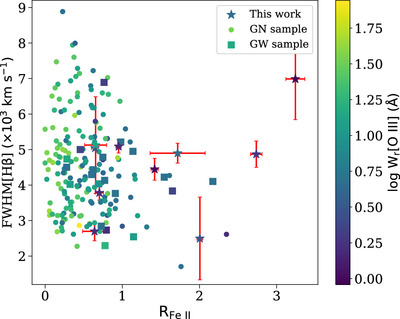
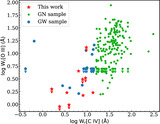
Caption: Figure 4.
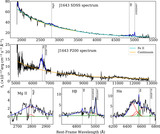
FWHM[Hβ] vs. R Fe II for our sample (stars), the GN sample (dots), and the GW sample (squares). We color-code the points by W r [O III] to illustrate the distribution of these quasars in the Eigenvector 1 plane. The error bars for the comparison samples are not shown for display purposes. Compared to typical quasars, WLQs show stronger optical Fe II emission and weaker [O III] emission in general.
Other Images in This Article
Copyright and Terms & Conditions
© 2024. The Author(s). Published by the American Astronomical Society.
Copyright ©
2026 Astronomy Image Explorer. All Rights Reserved.