Image Details
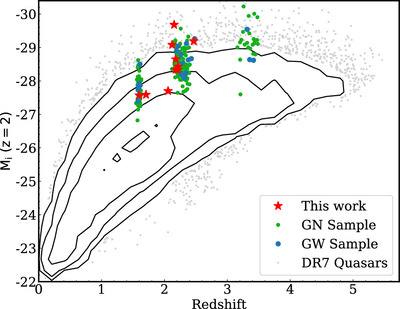
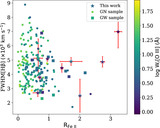
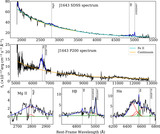
Caption: Figure 1.
Absolute i-band magnitude vs. redshift for our 10 objects (red stars). The underlying gray dots and black contours represent the distribution of objects in the SDSS DR7 quasar catalog. The lowest contour level denotes 101.6 quasars per bin (25 bins along each axis), and the increasing contours are logarithmically spaced by 0.6 dex; individual gray points are quasars falling below the lowest contour level. Our sources are among the most luminous quasars. The green and blue dots represent the GW and GN samples from the Matthews et al. (2023) GNIRS-DQS catalog that constitute our comparison samples.
Other Images in This Article
Copyright and Terms & Conditions
© 2024. The Author(s). Published by the American Astronomical Society.
Copyright ©
2026 Astronomy Image Explorer. All Rights Reserved.