Image Details
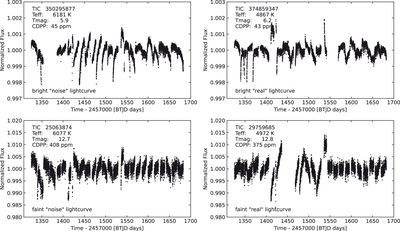
Caption: Figure 19.
Four example light curves comparing the noise and systematics for our quiescent training “noise” sample (left) and our “real” data (right). The photometric noise, quantified by the 6 hr CDPP, is a function of brightness and the same for both the training and real data. The TESS systematics are generally independent of the target and are shared by all light curves. They are shown here as observing gaps, steep jumps (e.g., at BTJD of 1425 and 1550 days), and ramps of sector-dependent increasing or decreasing flux with time.
Other Images in This Article
Show More
Copyright and Terms & Conditions
© 2024. The Author(s). Published by the American Astronomical Society.
Copyright ©
2025 Astronomy Image Explorer. All Rights Reserved.