Image Details
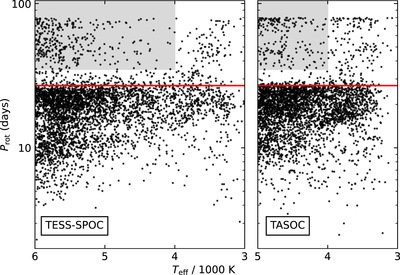
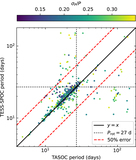
Caption: Figure 2.
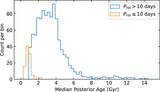
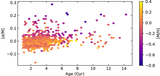
Period–temperature distribution for the TESS-SPOC (left) and TASOC (right) samples. Estimating periods using CNNs, we recover the short-period slope and intermediate-period gap seen in other rotating populations (e.g., McQuillan et al. 2014). Detection biases create a sharp edge at 27 days (red line), above which the period uncertainties are larger due to the sector-to-sector stitching necessary for long-baseline TESS light curves. Toward P rot = 90 days, contamination increases because less certain period estimates are biased toward the median period of the training set. The detections above P rot > 35 days and T eff > 4000 K (gray shaded region) are likely to be spurious, but most of the M-dwarf periods up to 80 days appear to be real.
Other Images in This Article
Show More
Copyright and Terms & Conditions
© 2024. The Author(s). Published by the American Astronomical Society.