Image Details
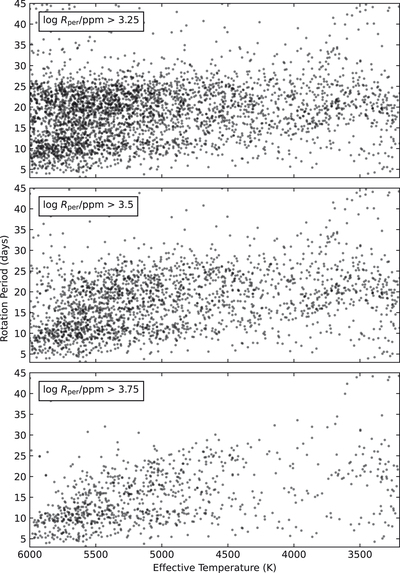
Caption: Figure 4.
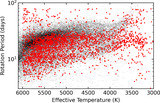
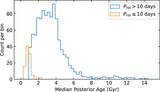
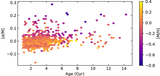
Distribution of periods and TIC temperatures for the TESS-SPOC sample, with varying lower bound on photometric variability range R per. All stars shown pass our reliability criterion (σ P /P ≤ 35%).
Other Images in This Article
Show More
Copyright and Terms & Conditions
© 2024. The Author(s). Published by the American Astronomical Society.
Copyright ©
2025 Astronomy Image Explorer. All Rights Reserved.