Image Details
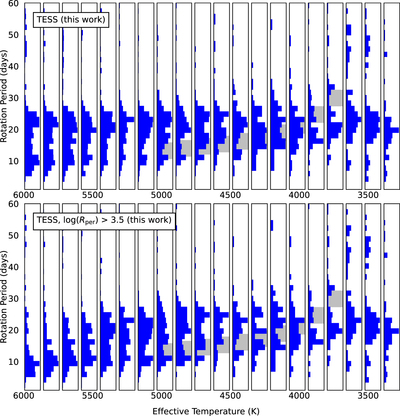
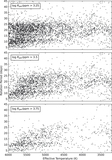
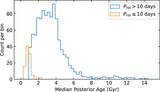
Caption: Figure 7.
Histogram representations for the period–temperature distribution of TESS, with no photometric variability cut (top), and restricting to ﹩\mathrm{log}({R}_{\mathrm{per}}/\mathrm{ppm})\gt 3.5﹩ (bottom). Our polynomial fit to the Kepler period gap is shown by the gray bands in each histogram, with width of 5 days chosen only for visibility. Temperatures are from the TIC.
Other Images in This Article
Show More
Copyright and Terms & Conditions
© 2024. The Author(s). Published by the American Astronomical Society.
Copyright ©
2025 Astronomy Image Explorer. All Rights Reserved.