Image Details
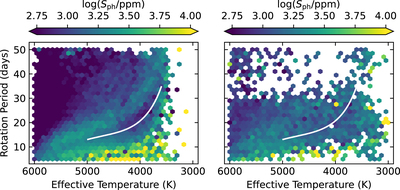
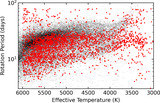
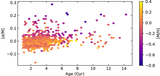
Caption: Figure 3.
The rotation period distribution vs. temperature for both the Kepler field (left; Santos et al. 2019, 2021) and TESS SCVZ (right; this work). The bins are colored by photometric variability index S ph, and the white curve represents a third-order polynomial fit to the Kepler period gap. As expected, amplitudes generally decrease with increasing period at fixed temperature. The amplitudes near the rotation gap in TESS are slightly smaller than those away from the gap in the same temperature and period ranges, in agreement with Kepler as shown left, and with K2 (Reinhold & Hekker 2020). The TESS bins above a temperature of 4000 K and above a period of 35 days nearly all have only a single star; this region is sparsely populated, and most periods here are likely to be spurious detections.
Other Images in This Article
Show More
Copyright and Terms & Conditions
© 2024. The Author(s). Published by the American Astronomical Society.