Image Details
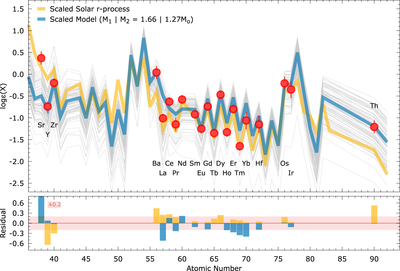
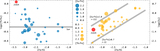
Caption: Figure 9.
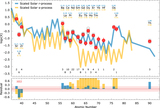
Upper panel: heavy-element chemical abundance pattern of SPLUS J1424−2542, compared with the scaled solar system r-process (yellow) and the best-fit neutron star merger model (blue), normalized to match the observed Eu abundance. Also shown (gray lines) are random realizations of the neutron star merger; see text for details. Lower panel: residuals between the observations and scaled predictions. A ±0.2 dex shaded area is shown for reference.
Other Images in This Article
Copyright and Terms & Conditions
© 2023. The Author(s). Published by the American Astronomical Society.
Copyright ©
2025 Astronomy Image Explorer. All Rights Reserved.