Image Details
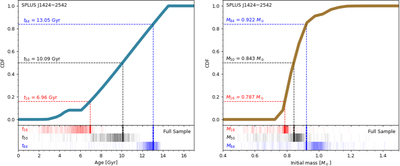
Caption: Figure 10.
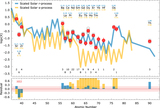
Age (left) and initial mass (right) CDFs obtained for SPLUS J1424−2542 using the Bayesian isochronal method described in Almeida-Fernandes et al. (2023). The dashed lines correspond to the 16th (red), 50th (black), and 84th (blue) percentiles used to characterize the parameters and their uncertainties. For comparison, the ticks in the bottom panels correspond to the 16th (red), 50th (black), and 84th (blue) percentiles for all 522 stars in the Placco et al. (2022) sample.
Other Images in This Article
Copyright and Terms & Conditions
© 2023. The Author(s). Published by the American Astronomical Society.
Copyright ©
2025 Astronomy Image Explorer. All Rights Reserved.