Image Details
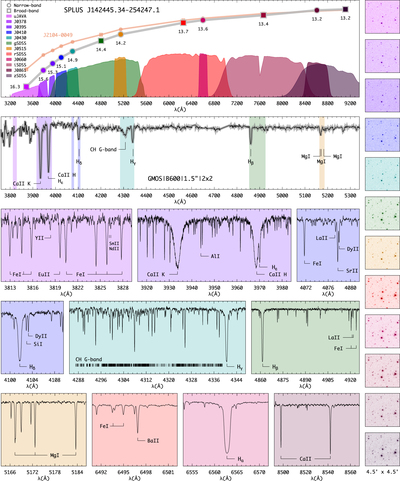
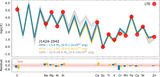
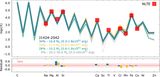
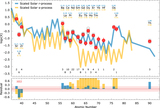
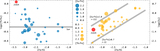
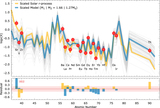
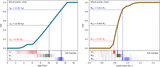
Caption: Figure 1.
Top: S-PLUS magnitudes for SPLUS J1424−2542 compared to the values for SPLUS J2104−0049. Also shown are the S-PLUS filter transmission curves. The second panel from top to bottom shows the Gemini/Gemini Multi-Object Spectrograph (GMOS) spectrum, highlighting absorption features of interest. The remaining color panels show sections of the GHOST spectra and features used for the chemical abundance determinations. The 12 side panels show the S-PLUS images for SPLUS J1424−2542. The RGB colors in all panels are assigned based on the central wavelength of each filter. See text for further details.
Other Images in This Article
Copyright and Terms & Conditions
© 2023. The Author(s). Published by the American Astronomical Society.
Copyright ©
2025 Astronomy Image Explorer. All Rights Reserved.