Image Details
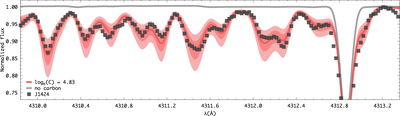
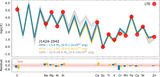
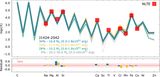
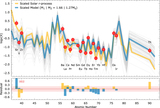
Caption: Figure 2.
Spectral synthesis for the determination of the carbon abundance. The red solid line shows the best-fit synthesis and uncertainties (±0.1 and ±0.2 dex—shaded regions) compared to the observed spectra (filled squares). Also shown is a synthetic spectrum after removing all contributions from carbon (gray line).
Other Images in This Article
Copyright and Terms & Conditions
© 2023. The Author(s). Published by the American Astronomical Society.
Copyright ©
2025 Astronomy Image Explorer. All Rights Reserved.