Image Details
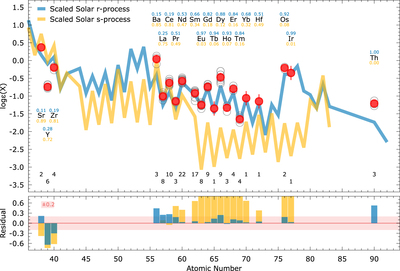
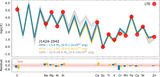
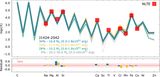
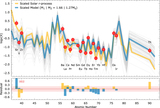
Caption: Figure 7.
Upper panel: heavy-element chemical abundance pattern of SPLUS J1424−2542, compared with the scaled solar system abundances. The r- and s-process contributions are calculated based on the fractions given by Burris et al. (2000) and scaled to match the observed abundances of Eu and Ba, respectively. Also shown are the r- and s-process fractions for each element (top), as well as the number of lines identified for each element (bottom). Open circles show the individual abundances for all the lines measured in the GHOST spectrum. Lower panel: residuals between the observations and the scaled solar system abundance patterns. A ±0.2 dex shaded area is shown for reference.
Other Images in This Article
Copyright and Terms & Conditions
© 2023. The Author(s). Published by the American Astronomical Society.