

Image Details
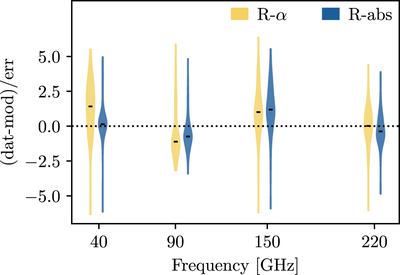
Caption: Figure 12.
Best-fit residual distribution for the spectral models in comparison. The yellow and blue colors represent R-α and R-abs, respectively. Each component of the graph shows the distribution of the residuals from the best-fit model. The two distributions for each frequency are arbitrarily offset for visualization.
Other Images in This Article

Show More
Copyright and Terms & Conditions
© 2023. The Author(s). Published by the American Astronomical Society.

Copyright ©
2026 Astronomy Image Explorer. All Rights Reserved.
