

Image Details
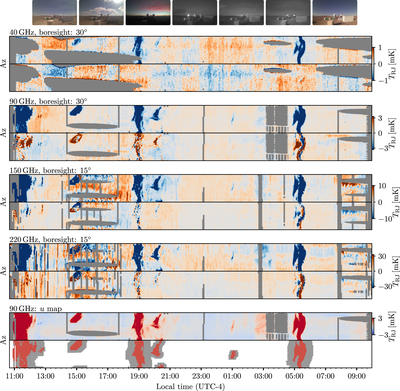
Caption: Figure 7.
Example of multifrequency polarized cloud observation starting on 2022 January 25. Top: sky images recorded by camera 3, shown in 3 hr intervals. As noted in Figure 5, the highest elevation of camera 3 is below the lowest elevation of the telescope; therefore, clouds in the camera image do not directly correspond to the az-map detections. Rows 1–8: Stokes Q (top) and U (bottom) az-maps for four CLASS frequency bands. The x-axis represents time, and the y-axis, from the bottom to the top of each panel, is the −180°–180° azimuth angle. The azimuthal coverage of camera 3 roughly corresponds to the lower quarter of the az-maps. The gray area shows missing data due to Sun avoidance or excessive detector flux jumps. Row 9: az-map of the detector frame Stokes u map for the 90 GHz band. Row 10: the cloud candidates identified from the 90 GHz u az-map. Red patches show the identified cloud candidates and the gray patches show the extended background region. All az-maps and camera images have the temporal axes aligned.
Other Images in This Article
Show More
Copyright and Terms & Conditions
© 2023. The Author(s). Published by the American Astronomical Society.

