

Image Details
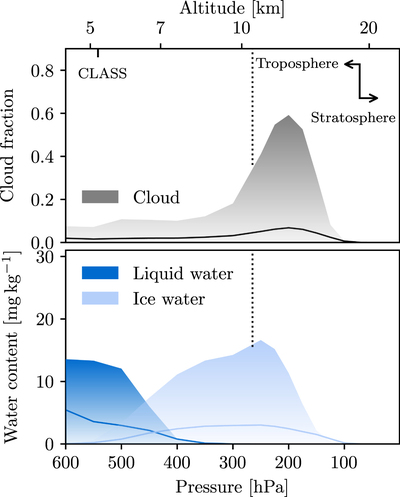
Caption: Figure 2.
Cloud fraction and water content profile near the CLASS site from 2016 August to 2022 May derived from ERA5 (Hersbach et al. 2020) per pressure level hourly data. The pressure levels are converted into altitudes above sea level (top axis) using the annually averaged atmosphere profile from Molod et al. (2015) and the hydrostatic equation. Top: cloud cover fraction as a function of atmospheric pressure (altitude). This quantity is the proportion of a grid box covered by cloud in the ERA5 model. Bottom: the specific cloud water content in the liquid (darker blue) and ice (lighter blue) phases. The area enclosed under the curves (in linear pressure axis) is proportional to the liquid- (Ice-) water path. In both panels, the solid curves show the mean value at given pressure levels; the shaded regions fill between the 50th and 95th percentiles of the distribution. Due to aridness at the queried region, the 50th percentiles are essentially zero. The vertical dotted line marks the altitude where the median air temperature is −40°C, above which (altitude) homogeneous nucleation occurs.
Other Images in This Article
Show More
Copyright and Terms & Conditions
© 2023. The Author(s). Published by the American Astronomical Society.

