

Image Details
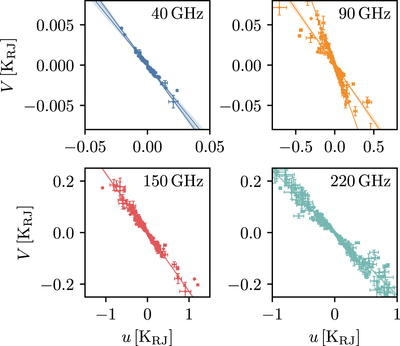
Caption: Figure 8.
Detected circular polarization as a function of the Stokes u amplitude. The colored line and the shaded region indicate the best linear fit between the two variables and should be interpreted as the measured transfer function bias term ﹩{\hat{B}}_{{vu}}﹩ and its uncertainty. Separate fits are performed for the 40 GHz data before and after 2021 February 11 due to the replacement of the VPM grid (Li et al. 2023). The 90 GHz panel also suggests a separate fit for data before and after 2019 May 20 due to a bimodal transition in the VPM system.
Other Images in This Article
Show More
Copyright and Terms & Conditions
© 2023. The Author(s). Published by the American Astronomical Society.

Copyright ©
2026 Astronomy Image Explorer. All Rights Reserved.
