Image Details
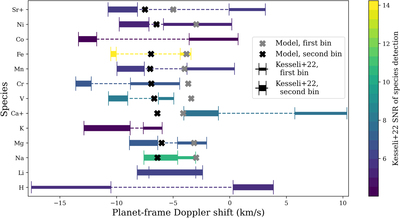
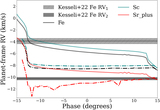
Caption: Figure 8.
The net Doppler shifts of Kesseli et al. (2022) (error bars) as compared to this work’s models (crosses). The first phase bin is drawn thinner than the second phase bin; observed phase bins are connected by a dotted line for visibility’s sake. The species are ordered and colored by total observed detection S/N. Rows without crosses correspond to species that we could not recover via cross-correlation in our models. Our models are able to explain some species (e.g., Na), fail to explain others (e.g., Cr) and fail to detect yet others (e.g., K).
Other Images in This Article

Copyright and Terms & Conditions
© 2023. The Author(s). Published by the American Astronomical Society.
Copyright ©
2025 Astronomy Image Explorer. All Rights Reserved.