Image Details

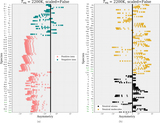
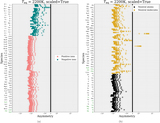
Caption: Figure 3.
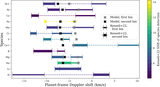
Asymmetry (per Equation (1)) for Sr II, Fe, H2O, and CO in our parameterized atmospheres. Our grid sweeps over equilibrium temperature and normalized temperature difference across limbs, and includes models that observe the scale height effect (circles) and do not (squares). We find that species with strong temperature-dependent abundances (e.g., Sr II) are less dominated by the scale height effect than species with weaker temperature-dependent abundances.
Other Images in This Article

Copyright and Terms & Conditions
© 2023. The Author(s). Published by the American Astronomical Society.
Copyright ©
2025 Astronomy Image Explorer. All Rights Reserved.