Image Details

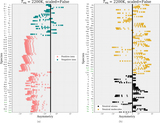
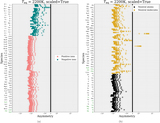
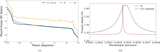
Caption: Figure 7.
CCFs of individual species averaged over two phase bins. Each column corresponds to different species (OH, CO, H2O), and each row corresponds to a different bin selection: without including ingress and egress, including the full transit, and only including ingress and egress. Central bars between the CCFs are colored blue if the difference between the CCFs is greater than optimal Doppler shift errors (1.55 km s−1, in black; Kesseli et al. 2022); otherwise, they are colored red. In our models, CO only displays detectable CCF differences when only including ingress and egress. The S/N in each plot refers to the difference between the two phase bins’ CCF peaks relative to the optimal Doppler shift errors.
Other Images in This Article
Copyright and Terms & Conditions
© 2023. The Author(s). Published by the American Astronomical Society.