Image Details
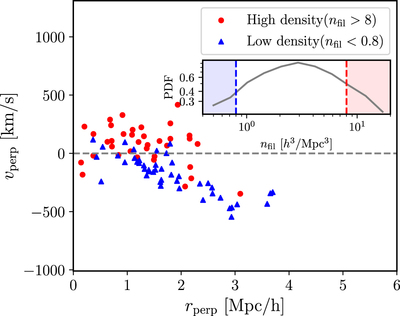
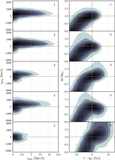
Caption: Figure 8.
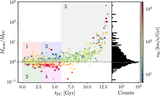
Phase-space distributions of halos at z = 0 that have crossed their pericenters more than 6 Gyr ago, subsampled by the density of filaments. The inset plot shows the filament density (n fil) distribution; high and low densities correspond to n fil/(h 3/Mpc3) > 8 and < 0.8, respectively. Each data point corresponds to one halo.
Other Images in This Article

Show More
Copyright and Terms & Conditions
© 2022. The Author(s). Published by the American Astronomical Society.
Copyright ©
2025 Astronomy Image Explorer. All Rights Reserved.