Image Details
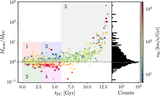
Caption: Figure 2.
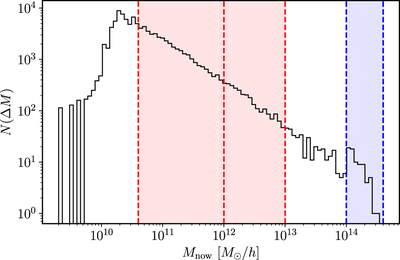
The mass distribution of halos in one of the N-Cluster Run simulations. We track the evolution of halos with 4 × 10¹⁰ M ⊙ h −1 ≤ M < 1013 M ⊙ h −1 (red) around filaments that are extracted from the region within 10 virial radii of massive halos of > 1014 M ⊙ h −1 (blue). The additional red dotted line at M = 1012 M ⊙ h −1 splits our halo sample into massive and less massive ones.
Other Images in This Article

Show More
Copyright and Terms & Conditions
© 2022. The Author(s). Published by the American Astronomical Society.