Image Details
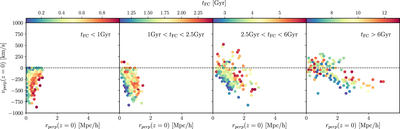
Caption: Figure 6.
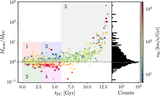
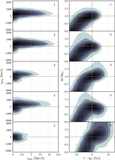
Phase-space distributions at z = 0 of halos subsampled by time since first crossing: [0, 1), [1, 2.5), [2.5, 6), and [6, 13.5) Gyr from left to right. The number of halos in each panel is 498, 491, 470, and 219, respectively. The color map is according to the mean time since first crossing (〈t FC〉) of halos in a given hexagonal bin.
Other Images in This Article

Show More
Copyright and Terms & Conditions
© 2022. The Author(s). Published by the American Astronomical Society.
Copyright ©
2025 Astronomy Image Explorer. All Rights Reserved.