Image Details
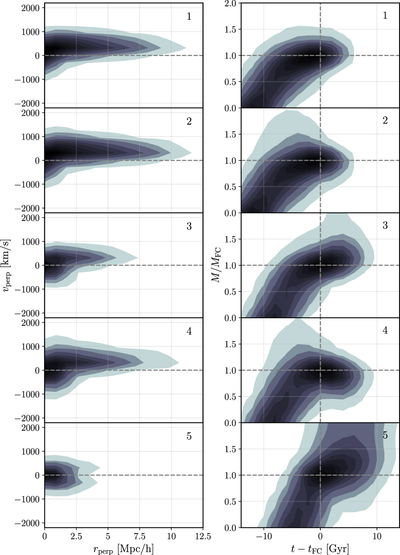
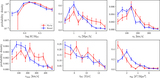
Caption: Figure 10.
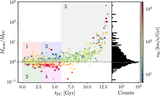
Stacked phase-space trajectories (left) and mass evolution profiles (right) of halos in the five subsamples in Figure 9: 1/2 for recent crossers, 3/4 for intermediate crossers, 5 for ancient crossers, 1/3/5 for mass-gaining halos, and 2/4 for mass-losing halos. Because the first crossing moment differs between halos, individual mass evolution profiles are stacked after making the first crossing moment the zero-point (i.e., t − t FC). That is, t − t FC < 0 and > 0 are before and after the first crossing, respectively.
Other Images in This Article

Show More
Copyright and Terms & Conditions
© 2022. The Author(s). Published by the American Astronomical Society.
Copyright ©
2025 Astronomy Image Explorer. All Rights Reserved.