Image Details
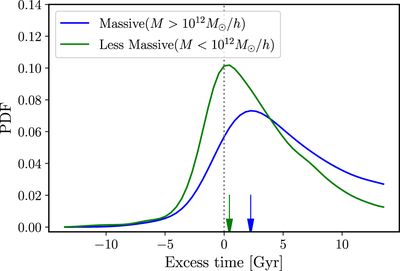
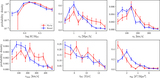
Caption: Figure 13.
The distributions of excess time of massive halos (blue) and less massive halos (green). The excess time is defined by halo age subtracted by the required time to reach a 2 Mpc h −1 distance from filaments, assuming that halos travel at their initial velocity. Each arrow indicates the peak position.
Other Images in This Article

Show More
Copyright and Terms & Conditions
© 2022. The Author(s). Published by the American Astronomical Society.
Copyright ©
2025 Astronomy Image Explorer. All Rights Reserved.