Image Details
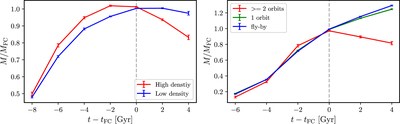
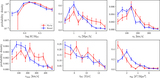
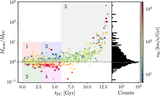
Caption: Figure 11.
Stacked mass evolution profiles of recent crossers (t FC < 3 Gyr) subsampled based on their closest filament density as in Figure 8 (left) and those of intermediate crossers (4 ≤ t FC/Gyr < 9) subsampled by the number of orbits (right). Note that the left and right panels are of different halo samples. Each axis is normalized by the value at the first crossing.
Other Images in This Article

Show More
Copyright and Terms & Conditions
© 2022. The Author(s). Published by the American Astronomical Society.
Copyright ©
2025 Astronomy Image Explorer. All Rights Reserved.