Image Details

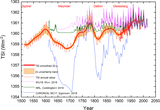
Caption: Figure 5.
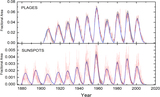
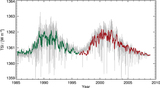
Annual values of the fractional solar disk coverage by plage as a function of time. This composite is derived by merging the values from a reconstructed time series using Equation (5) (red solid line) and observed data (green solid line). The light red region indicates the uncertainty range in the reconstructed time series, while the light green region shows the 5σ confidence interval of the mean annual value.
Other Images in This Article
Copyright and Terms & Conditions
© 2022. The Author(s). Published by the American Astronomical Society.
Copyright ©
2025 Astronomy Image Explorer. All Rights Reserved.