Image Details
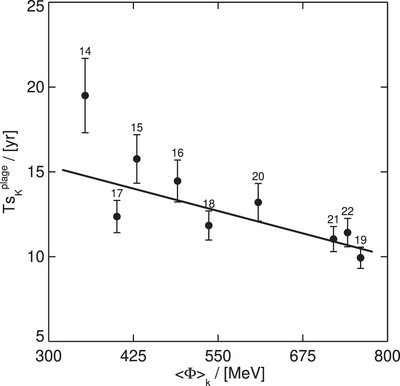
Caption: Figure 4.
Dependence of the parameter Ts k on the k-cycle averaged solar modulation potential 〈Φ〉 k . Individual solar cycle numbers are indicated in the plot, while the error bars are 1σ standard error of the mean. This relationship is well described by the linear model (solid line) given by Equation (5). The Pearson’s correlation coefficient is −0.77, at a confidence level greater than 95%.
Other Images in This Article
Copyright and Terms & Conditions
© 2022. The Author(s). Published by the American Astronomical Society.
Copyright ©
2025 Astronomy Image Explorer. All Rights Reserved.