Image Details
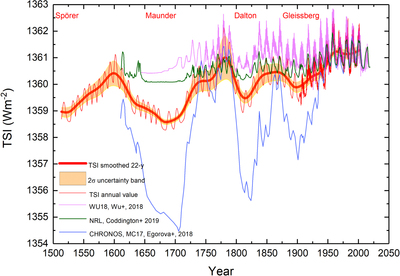
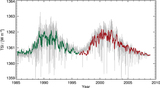
Caption: Figure 10.
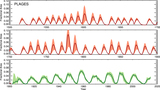
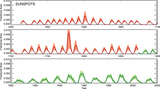
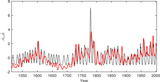
Four reconstructions of TSI are reported, obtained with different methods for comparison purposes only. Our TSI reconstruction is shown as a continuous red line; the red bold line is the TSI smoothed over a period of 22 yr with a 2σ uncertainty shown as the orange stripe. The NRL-TSI data Climate Data Record (green line) is from Coddington et al. (2019). TSI values from Wu et al. (2018) are in magenta. CHRONOS, MC17 TSI values from Egorova et al. (2018) are in blue. The names refer to the grand minima that occurred in the analyzed period, i.e., Spörer, Maunder, Dalton, and Gleissberg.
Other Images in This Article
Copyright and Terms & Conditions
© 2022. The Author(s). Published by the American Astronomical Society.
Copyright ©
2025 Astronomy Image Explorer. All Rights Reserved.