Image Details
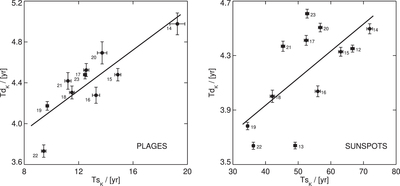
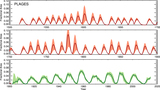
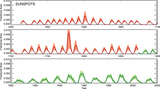
Caption: Figure 1.
Relationship between the parameters Td k and Ts k for plage (left) and sunspot (right) areas. The sunspot data include the additional cycles 12 and 13. The filled circles, with 1σ error bars, show the data averaged over the individual solar cycle numbers. The regression lines, computed using a Bayesian method (Kelly 2007), are given by Equation (2).
Other Images in This Article
Copyright and Terms & Conditions
© 2022. The Author(s). Published by the American Astronomical Society.
Copyright ©
2025 Astronomy Image Explorer. All Rights Reserved.